Planning
The Planning screen is the project's Gantt view: this is where you build the structure of tasks and milestones, set their dates and dependencies, and assign resources. You reach it from the Planning menu in the project sidebar.
- Gantt (planned) — the screen offers a full planning experience: WBS, dependencies, constraints, auto schedule, baselines.
- Kanban / Scrum — the screen is still available. For these projects, day-to-day work is rather driven from Card & Story.
Anatomy of the screen
The screen is made of three areas:
- The toolbar at the top — add, edit, move, zoom, filter and export
- The task grid on the left — the task tree and its columns
- The Gantt chart on the right — time bars, dependencies, baselines and resources
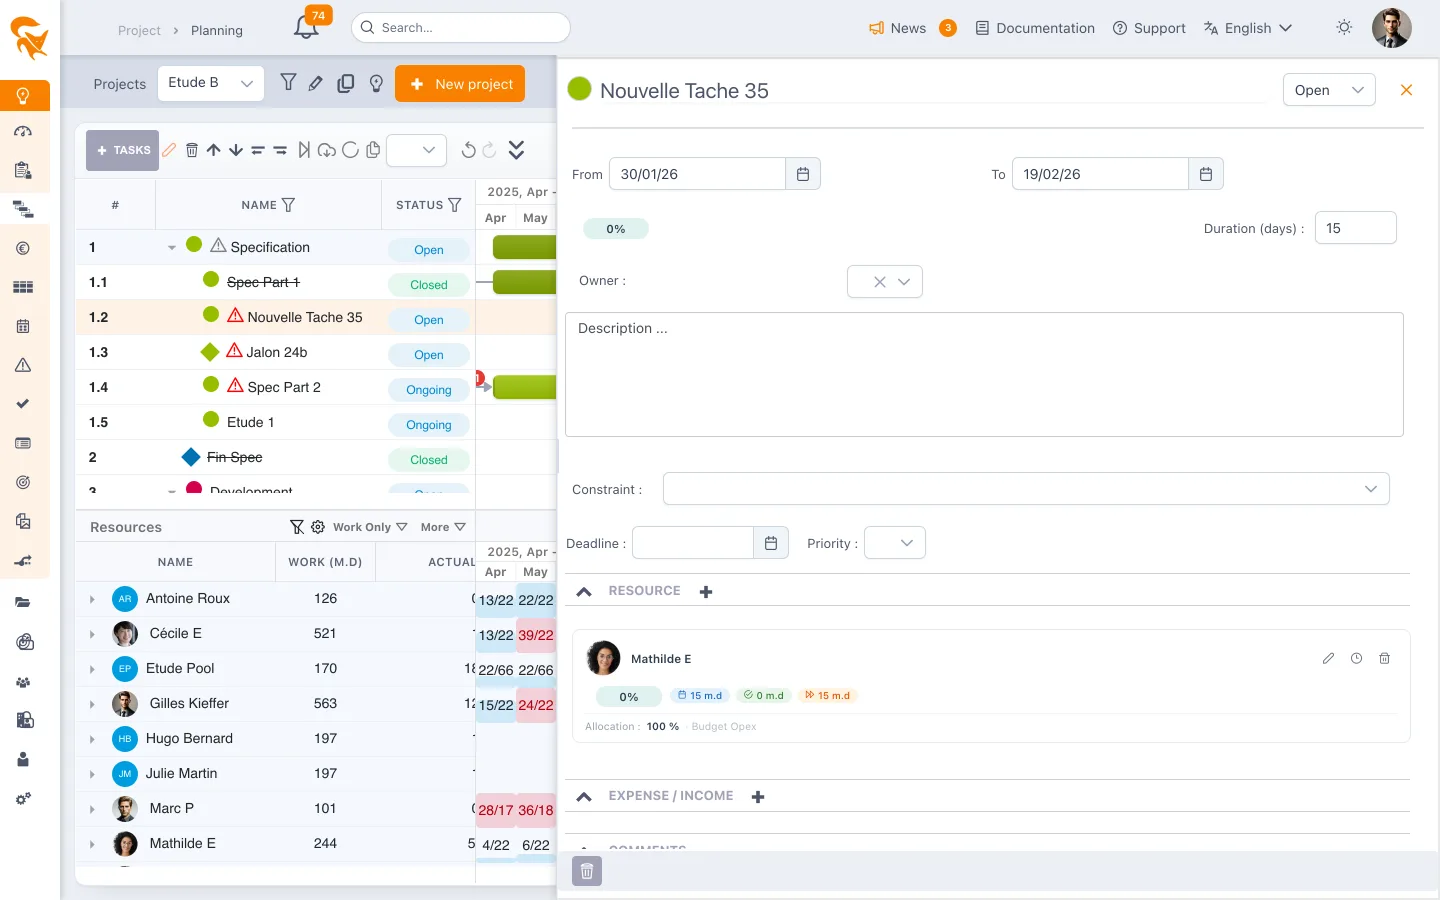
A side edit panel opens when clicking a task to edit its attributes without leaving the screen.
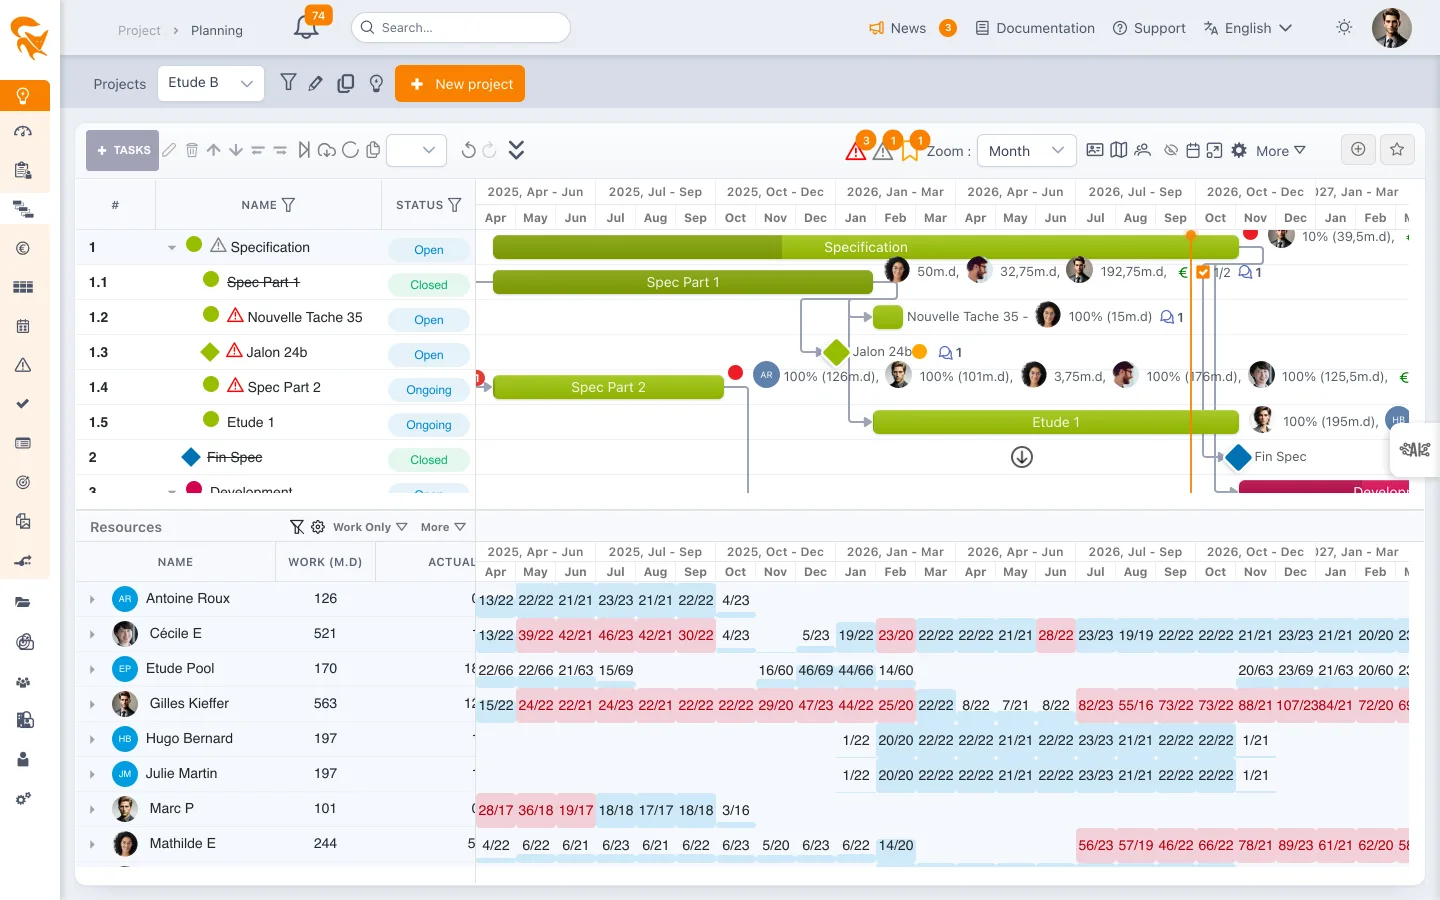
The toolbar

Create and edit
- + Task — main button to add a task or a milestone (context menu on click)
- ✏️ Edit the selected task — opens the full editor
- 🗑️ Delete the selected task (confirmation required beyond a single task)
- ⬆️ / ⬇️ Move the task up or down in the list
- ⬅️ / ➡️ Indent / outdent the task (create or break a subtask)
Organize the planning
- ⏭️ Shift the project — shifts every task by setting a new project start date
- ☰ Run auto schedule — applies the auto schedule to the relevant tasks (shown when at least one manual task needs to be recomputed)
- ☁️⬇️ Import tasks from a template — inserts the content of a template project into the current project
- 🔁 Refresh the planning data
- 📋 Copy tasks — opens a dialog to copy one or several tasks (with their allocations, comments and linked documents) into the current project or to another project → see Copy tasks
- 🔽 Bulk import of tasks — tabular entry to create many tasks at once
- 🔍 Search / filter a task — drop-down listing every task in the project
- ↶ / ↻ Undo / Redo — revert the last changes (tasks and assignments), then replay them → see Undo and redo
Alert indicators
On the right side of the toolbar, FoxPlan shows alert badges about task health:
- ⚠️ Tasks to close — tasks whose end date has passed and that are not done
- ⚠️ Late tasks — ongoing tasks whose expected start or progress is not met
- 🔖 Tasks with a remaining workload (RAF) to refresh

Clicking a badge opens the detail of the matching tasks.
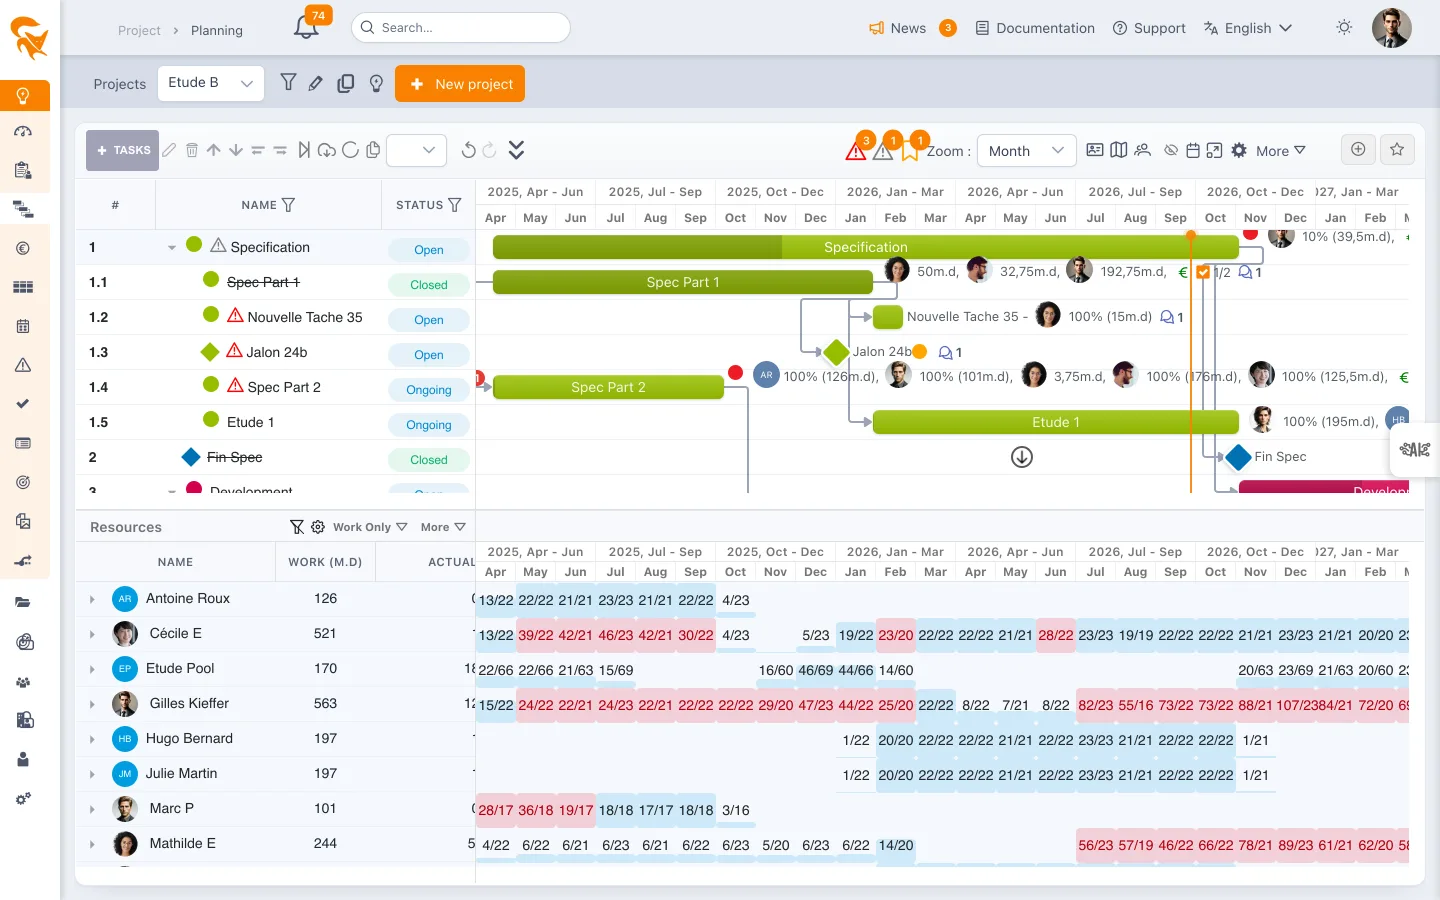
Zoom and visualization
- Zoom — switches the time scale: Year / Quarter / Month / Week / Day
- 🪪 Resources panel — opens a side panel to drag and drop resources onto tasks
- 🗺️ Planning view — toggles between Gantt and resources view
- 👥 Performance mode — hides resources to speed up the display of very large plannings
- 👁️ Show / hide the chart — only displays the task grid
- 📅 Display period — limits the Gantt view to a date range
- ⛶ Fullscreen
- ⚙️ View settings — columns, baselines, display options (see below)

The "More" menu
The More button gathers the secondary actions:
- Expand all / collapse all — unfolds or folds the task tree
- Import an MS Project file (.mpp, .xml, .mpx, .mpd) — only dates and dependencies are imported, not resources
Exports
The download icon, between More and the favorite, gathers every export: PNG, PDF, Excel, CSV, MS Project and Project planning (.pptx).
Export the plan to PowerPoint
Project planning (.pptx) builds a PowerPoint presentation of the planning as displayed: the rows expanded on screen (a collapsed phase appears alone), in the view's order and with its filters. Each row is indented by level, with its dates; phases are drawn as a thin bar, tasks as a bar in the Gantt colour with the completed part darker, milestones as diamonds, deadlines as arrow badges and dependencies as arrowed connectors. Beyond 14 rows, the planning continues on further slides. Every shape is native PowerPoint, so it can be edited; the resource grid (lower part) has its own export, described below.
Export the workload to PowerPoint
In the resource grid (lower part of the screen), the header's More menu offers Workload export (.pptx). It builds a PowerPoint presentation of the resource grid, as editable native tables: one row per resource, one column per period of the displayed scale, plus the total. Each cell mirrors the on-screen display — "workload/capacity", workload only or percentage, depending on the cell display options — on a red background when overloaded (planned > capacity) and blue when the planned workload fits within capacity; a legend explains the colours. Beyond 20 resources or 12 periods, the table continues on further slides. The figures are the same as in the Excel export.
Favorites
The Favorite selector on the far right lets you save a combination of filters, columns and zoom to replay it in one click.
Create tasks and milestones
When clicking + Task, a menu offers:
- Add a task — planned item with start, end, duration and resources
- Add a milestone — checkpoint without duration
When creating / editing a task, you fill in among others:
- Name (required)
- Start date, end date, duration
- Progress (% or actual / remaining)
- Assigned resources and allocations (% or man-days)
- Predecessors (dependencies) and link type (FS, SS, FF, SF) with lag
- Scheduling constraint (see Project management)
- Deadline, priority, status, description
Dependencies
Dependencies are created visually in the Gantt (drag between two bars) or via the edit panel. FoxPlan supports the four classic links:
| Link | Meaning |
|---|---|
| Finish → Start (FS) | The next task starts when the previous one is finished (default) |
| Start → Start (SS) | Both tasks start at the same time |
| Finish → Finish (FF) | Both tasks end at the same time |
| Start → Finish (SF) | The end of the next is tied to the start of the previous |
A lag (positive or negative, in days) can be applied to each link.
Assign resources
Three ways to assign a resource to a task:
- From the task edit panel, add an allocation and enter a percentage or a number of man-days
- Drag and drop from the Resources panel (🪪 icon in the toolbar) onto a Gantt bar — a small form then asks for
% / man-daysand the budget to charge against if several are available - Bulk assign on several selected tasks via the context menu
The resources panel shows for each member their workload percentage over the visible period, with a color code (under-load / load / over-load).
Task actual type
If the workspace has several actual types active, the task edit panel shows an Actual type field, next to the priority.
- Empty ("Inherited from the envelope"): the task uses the type of each allocation's budget envelope.
- Set: this type takes precedence over the envelope's — useful for a non-billed phase (warranty, internal acceptance testing) within a billable envelope.
It is the type offered by default in the timesheet of the assigned resources. As long as a resource has entered nothing, their line follows the task's type; as soon as they have entered time, their choice prevails.
Auto schedule
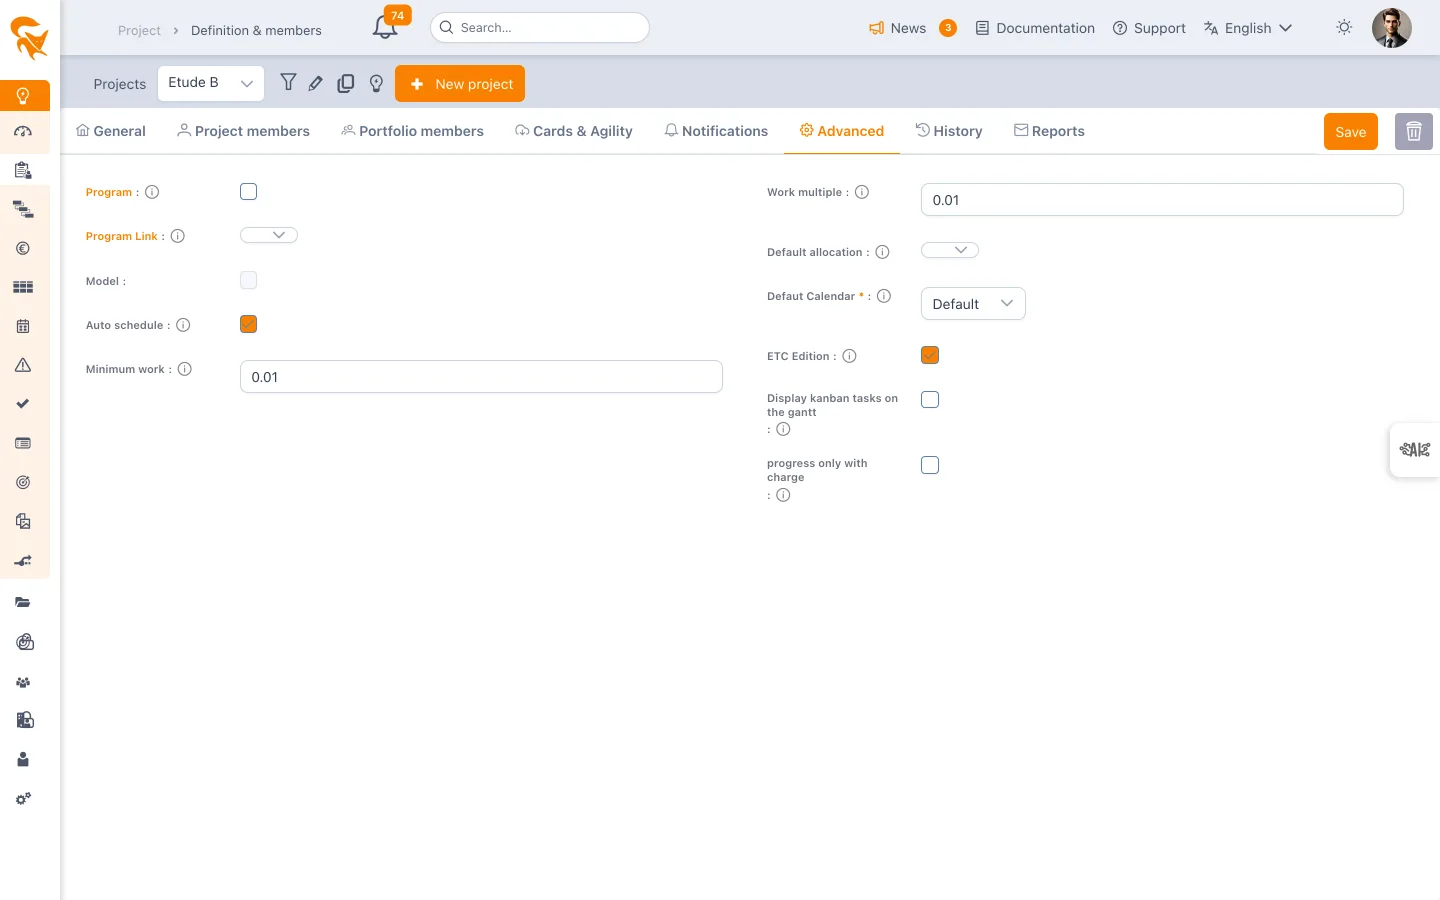
Auto schedule automatically recomputes the task dates while respecting their dependencies and constraints. It is enabled task by task, in the Other section of the edit panel.
A task with no predecessor has the As soon as possible constraint by default: it is placed as early as possible, i.e. at the start of its phase. When you drag it in the Gantt, its constraint becomes Start no earlier than, set to the date where you dropped it: the task stays there, including after a reload. A predecessor still takes precedence: the task cannot start before it. To move it back to the start of its phase, set its constraint back to As soon as possible in the edit panel.
When a change triggers a pending recompute, a ✅ Validate and ❌ Cancel button appear on the right side of the toolbar: you preview the effect before saving.
The default settings (auto-schedule on or off for new tasks) are configured under Definition & Members at the project level.
View settings
The ⚙️ icon opens a dialog with three tabs:
Columns
Selects the visible columns in the left grid (Name, Start, End, Duration, Progress, Resources, Budget, custom fields, etc.). Order and width are memorized and can be saved in a favorite.
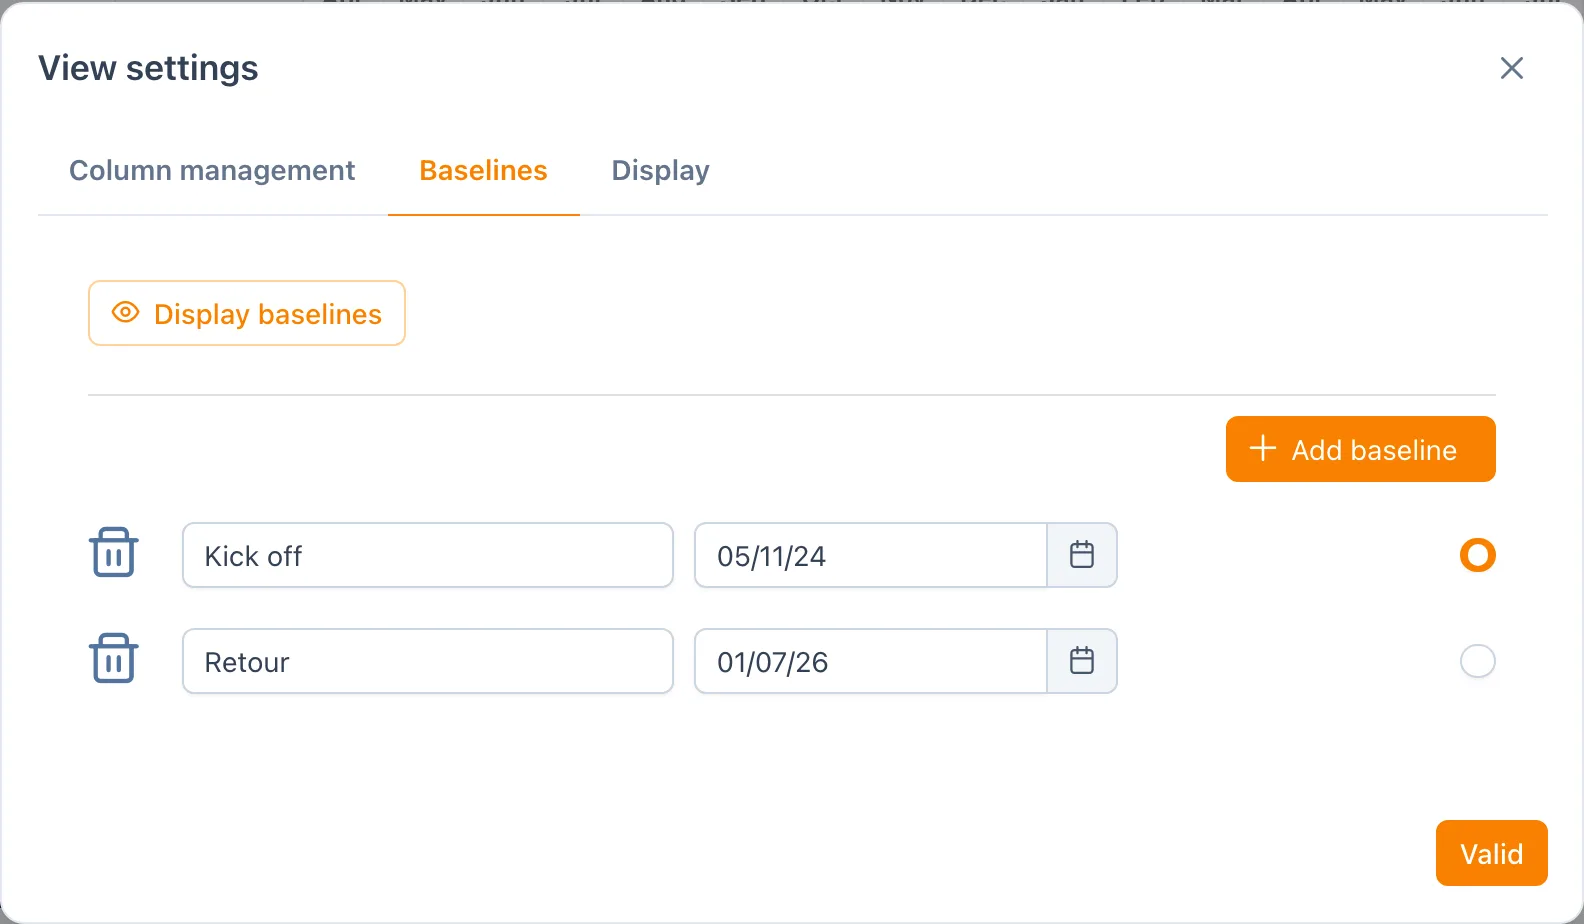
Baselines
A baseline is a snapshot of the planning at a given point in time, useful to compare the initial planning with the actual.
- Show / hide the active baseline in the Gantt
- + Add a baseline — label + date
- Choose the baseline visible at portfolio level (radio)
- 🗑️ Delete a baseline
Visualize
Toggle the display of:
- Actual — overlay of real progress on the bars
- Critical path — highlights the sequence driving the project end date
- Week number in the time scale
- Avatar of resources on the bars
- Alerts (delays, missed deadlines)
Filter and search
- Search by task name in the toolbar drop-down
- Advanced filters via favorite: by owner, by status, by period, by custom field
- Display period (📅 icon) — restricts the visible time window
- Indicators ⚠️ — a click isolates tasks in alert
Jira synchronization
For a project linked to Jira, a Start sync button shows in the toolbar. It triggers a two-way import / export of tickets and their status.
Permissions
Editing the planning follows the member's role in the project:
| Role | Planning edition |
|---|---|
| Project Admin | ✅ Full edit |
| Project Leader | ✅ Full edit |
| Reader | 👁️ Read-only |
| Resource | 👁️ Read-only (can update progress on their own tasks if the workspace allows it) |
Full details in Project members.
Resource grid totals
In the Resources area (bottom of the screen), each resource row shows the total of its allocations on this project's tasks, for every numeric column (Planned, Actuals, ETC, Δ ETC, custom fields…). The “Other projects” row is not included in these totals.
See also
- Project management — project creation, scheduling constraints, deadlines
- Undo and redo — recover from a mistake on the planning
- Card & Story — the complementary agile view
- Budget management — how allocations feed budgets
Before a major milestone, take a baseline: you will then be able to objectively measure the slippage and explain it at the steering committee.