Task list
The Task list screen is the tabular view of the project's tasks: it complements the Planning screen (Gantt) by offering a powerful grid to filter, sort, group and bulk-edit tasks. You reach it from the Task list menu in the project sidebar.
- Planning (Gantt) — when you are working on the time structure: durations, dependencies, milestones, baselines.
- Task list — when you are working on the data: bulk updates, progress check, field-based search, export.
Anatomy of the screen
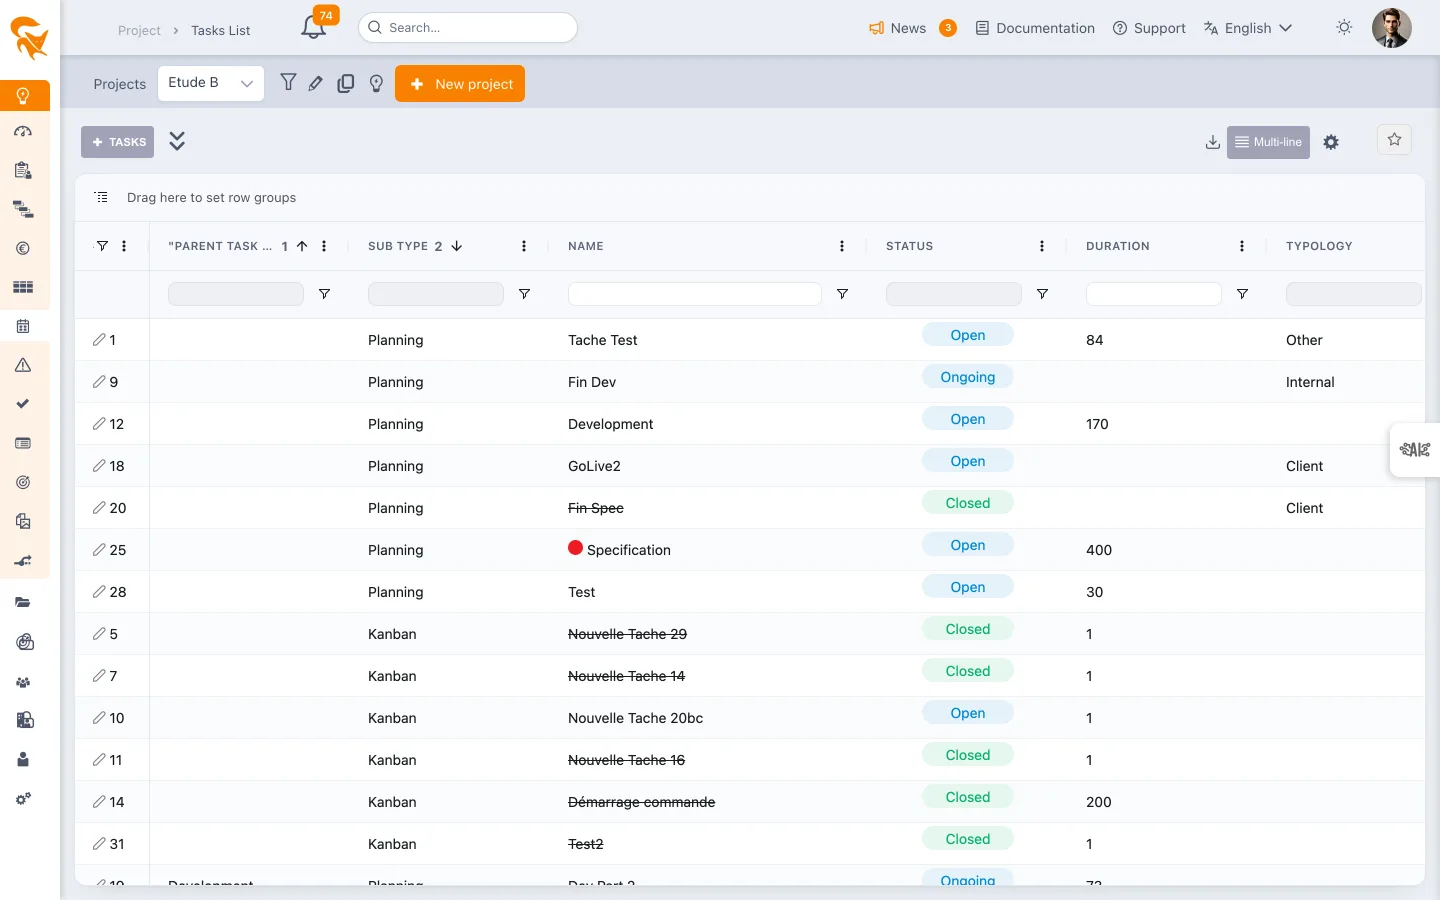
- The toolbar at the top — add, bulk import, display toggle, columns manager, exports, favorites
- The grid in the center — one row per task, configurable columns, filters and sort per column
- The side edit panel — opens when clicking the row number to edit the task in depth (same fields as in the Gantt)
The toolbar
Create
The + Task button opens a context menu offering:
- Add a milestone — checkpoint without duration
- Add a task — classic planned task
- Add a card — attached story / bug / action type item
The button is disabled if the project is read-only.
Bulk import
The 🔽 Bulk import of tasks icon opens a tabular editor that lets you create or update many tasks at once (copy-paste from Excel, line-by-line entry, column mapping). On save, the list is reloaded.
Display mode: single-line / multi-line
A toggle button lets you choose how cells are rendered:
- Single line — each row is compact (truncated if too long); handy to scan many tasks
- Multi-line — cells grow vertically to show the full content (descriptions, resource lists, comments)
The setting is remembered.
Manage columns
The ⚙️ icon opens the View settings, Column management tab. Two lists side by side: on the left the available fields (standard + custom), sorted alphabetically in your language; on the right the displayed columns, in their display order.
Everything is done by dragging and dropping between the two lists:
- Add — drag a field from the left to the right. Dropped on a row, it takes that position; dropped on the empty part of the list, it is appended at the end.
- Remove — drag a column from the right to the left.
- Reorder — drag a column up or down within the right-hand list: it takes the position of the row you drop it on, which is highlighted while you drag. The arrows next to the list do the same thing, one step at a time.
Order, width and pinning are remembered and can be saved in a favorite.
Export
The Export menu offers:
- Excel (.xlsx) — export the visible grid content
- CSV (.csv) — delimited text file
The export reflects the columns, order, filters and grouping active at export time.
Favorites
The Favorite selector on the right saves a full view: visible columns, order, widths, filters, sorts and grouping. Perfect for materializing recurring business views ("Late tasks", "Sprint tasks", "My quarterly deliverables"…).
Working in the grid
In-place edit
Most cells are editable in place: double-click the cell, type, validate with Enter. Saving is automatic when the value changes.
Some structural fields (dependencies, detailed allocations, scheduling constraints) still need to be edited from the side panel (see below).
Open the full edit panel
Clicking the row number (first column) opens the task side edit panel: it is the same panel as in the Gantt, giving access to every field (dates, resources, allocations, predecessors, comments, linked risks, etc.).
Comment column
The Comment column shows the latest comment posted on each task or card (plain text, without formatting). Add or remove it from the column manager, like any other field. It updates as soon as a comment is added, edited or deleted from the side panel, can be filtered and sorted like the other columns, and is included in the Excel and CSV exports when displayed.
Filter
Each column offers a menu filter (≡ icon in the header):
- Text filters (contains, starts with, equals…)
- Numeric filters (=, ≠, <, >, between…)
- Date filters (before, after, between)
- List filters (check the values to keep)
Multiple filters combine: the grid shows tasks matching all criteria.
Sort
Click a column header to sort ascending, click again for descending, a third click clears the sort. Hold Shift to add a secondary sort on another column.
Group
Drag a column header onto the grouping bar at the top of the grid to group tasks by that value (owner, status, phase, priority, etc.). Several grouping levels can be combined.
Grouping works with filters and sorts; it is included in favorites.
Resize and reorder columns
- Width: drag the right border of the column header
- Order: drag and drop the header to a new position
- Pin: via the header menu, pin a column left or right to keep it visible while scrolling
Changes are remembered and can be captured in a favorite.
Permissions
Editing the list follows the member's role in the project:
| Role | List edition |
|---|---|
| Project Admin | ✅ Full edit |
| Project Leader | ✅ Full edit |
| Reader | 👁️ Read-only (filters / sorts / exports allowed) |
| Resource | 👁️ Read-only (can update progress on their own tasks if the workspace allows it) |
If the whole project is read-only (closed template, archive), creation buttons are disabled. Full details in Project members.
See also
- Planning — the complementary Gantt view
- Project management — project creation and scheduling constraints
- Card & Story — the agile view for story / bug / action items
For a weekly progress meeting, create a "Weekly review" favorite that shows the columns Name, Owner, Deadline, Progress, Remaining, Status, filtered on in-progress or late tasks, grouped by owner. One click and you get exactly the view you need every week.