Planning
The Planning screen is the project's Gantt view: this is where you build the structure of tasks and milestones, set their dates and dependencies, and assign resources. You reach it from the Planning menu in the project sidebar.
- Gantt (planned) — the screen offers a full planning experience: WBS, dependencies, constraints, auto schedule, baselines.
- Kanban / Scrum — the screen is still available. For these projects, day-to-day work is rather driven from Card & Story.
Anatomy of the screen
The screen is made of three areas:
- The toolbar at the top — add, edit, move, zoom, filter and export
- The task grid on the left — the task tree and its columns
- The Gantt chart on the right — time bars, dependencies, baselines and resources
A side edit panel opens when clicking a task to edit its attributes without leaving the screen.
The toolbar
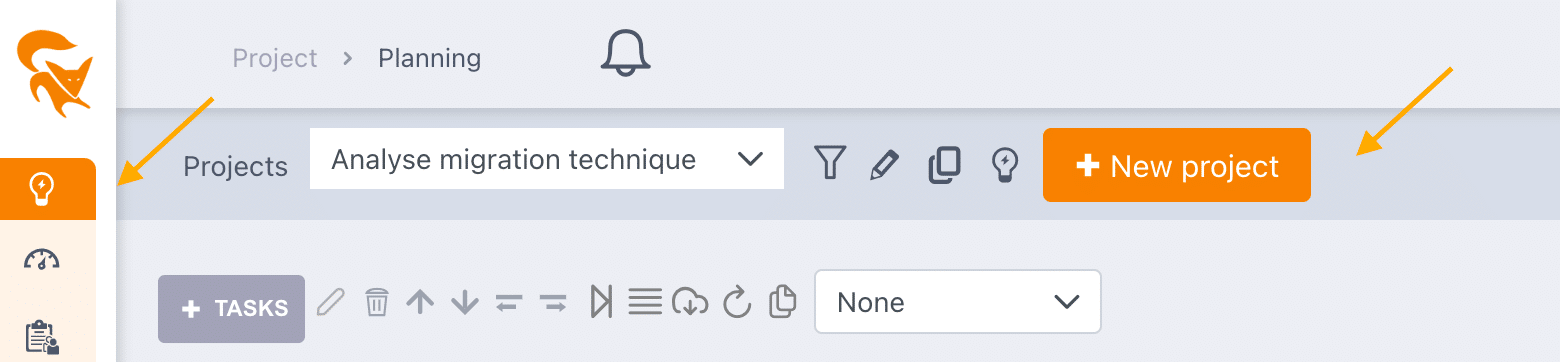
Create and edit
- + Task — main button to add a task or a milestone (context menu on click)
- ✏️ Edit the selected task — opens the full editor
- 🗑️ Delete the selected task (confirmation required beyond a single task)
- ⬆️ / ⬇️ Move the task up or down in the list
- ⬅️ / ➡️ Indent / outdent the task (create or break a subtask)
Organize the planning
- ⏭️ Shift the project — shifts every task by setting a new project start date
- ☰ Run auto schedule — applies the auto schedule to the relevant tasks (shown when at least one manual task needs to be recomputed)
- ☁️⬇️ Import tasks from a template — inserts the content of a template project into the current project
- 🔁 Refresh the planning data
- 📋 Copy tasks — opens a dialog to copy one or several tasks (with their allocations, comments and linked documents) into the current project or to another project → see Copy tasks
- 🔽 Bulk import of tasks — tabular entry to create many tasks at once
- ⬆️ Import an MS Project file (.mpp, .xml, .mpx, .mpd)
- 🔍 Search / filter a task — drop-down listing every task in the project
- ↶ / ↻ Undo / Redo — revert the last changes (tasks and assignments), then replay them → see Undo and redo
Alert indicators
On the right side of the toolbar, FoxPlan shows alert badges about task health:
- ⚠️ Tasks to close — tasks whose end date has passed and that are not done
- ⚠️ Late tasks — ongoing tasks whose expected start or progress is not met
- 🔖 Tasks with a remaining workload (RAF) to refresh

Clicking a badge opens the detail of the matching tasks.

Zoom and visualization
- Zoom — switches the time scale: Year / Quarter / Month / Week / Day
- 🪪 Resources panel — opens a side panel to drag and drop resources onto tasks
- 🗺️ Planning view — toggles between Gantt and resources view
- 👥 Performance mode — hides resources to speed up the display of very large plannings
- 👁️ Show / hide the chart — only displays the task grid
- 📅 Display period — limits the Gantt view to a date range
- ⛶ Fullscreen
- ⚙️ View settings — columns, baselines, display options (see below)

The "More" menu
The More button gathers the secondary actions:
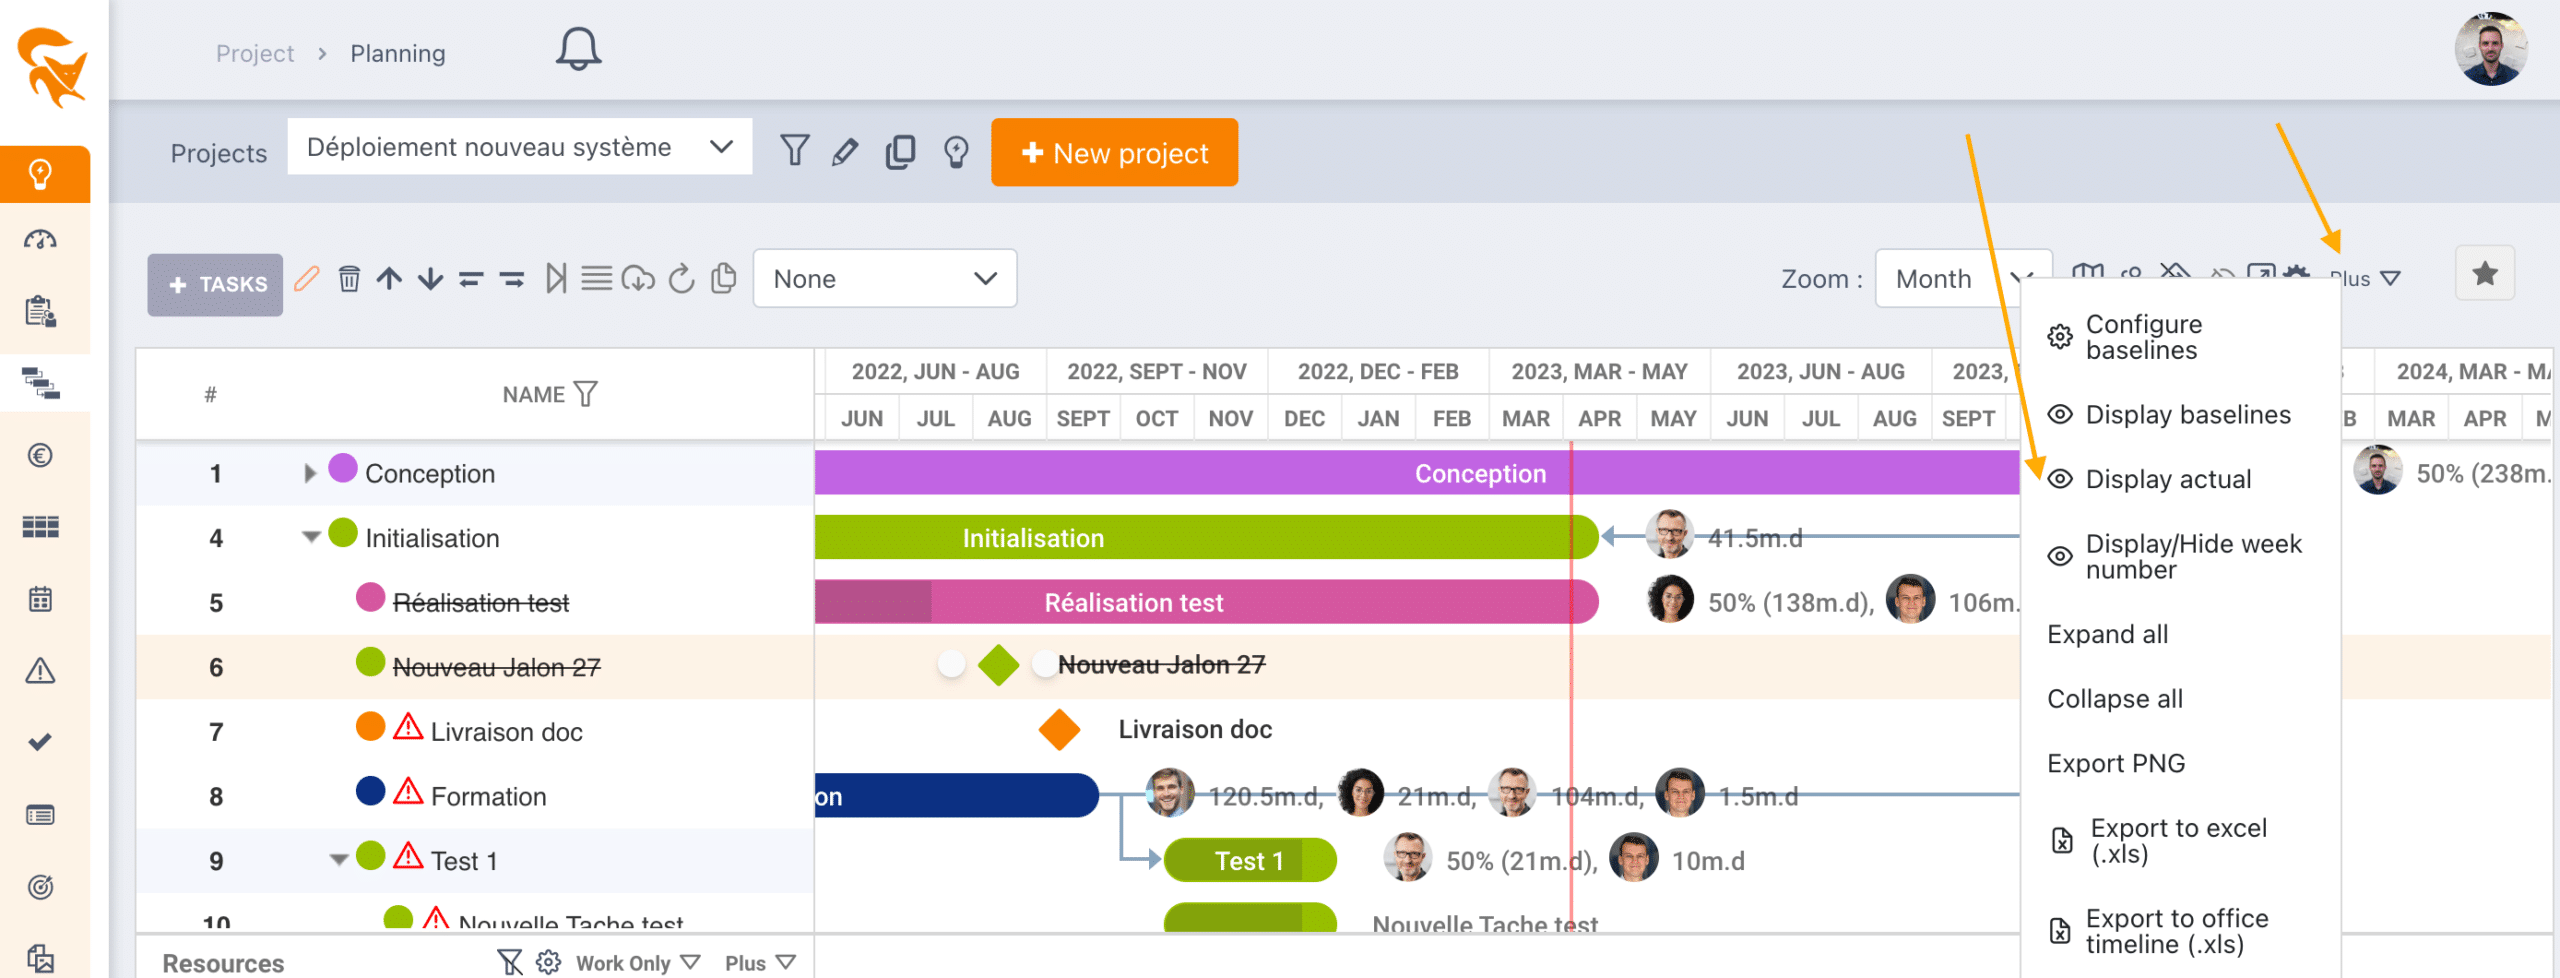
- Expand all / collapse all — unfolds or folds the task tree
- Export PNG, PDF, Excel, CSV
- Office Timeline export
- MS Project export (dynamic or static)
Favorites
The Favorite selector on the far right lets you save a combination of filters, columns and zoom to replay it in one click.
Create tasks and milestones
When clicking + Task, a menu offers:
- Add a task — planned item with start, end, duration and resources
- Add a milestone — checkpoint without duration
When creating / editing a task, you fill in among others:
- Name (required)
- Start date, end date, duration
- Progress (% or actual / remaining)
- Assigned resources and allocations (% or man-days)
- Predecessors (dependencies) and link type (FS, SS, FF, SF) with lag
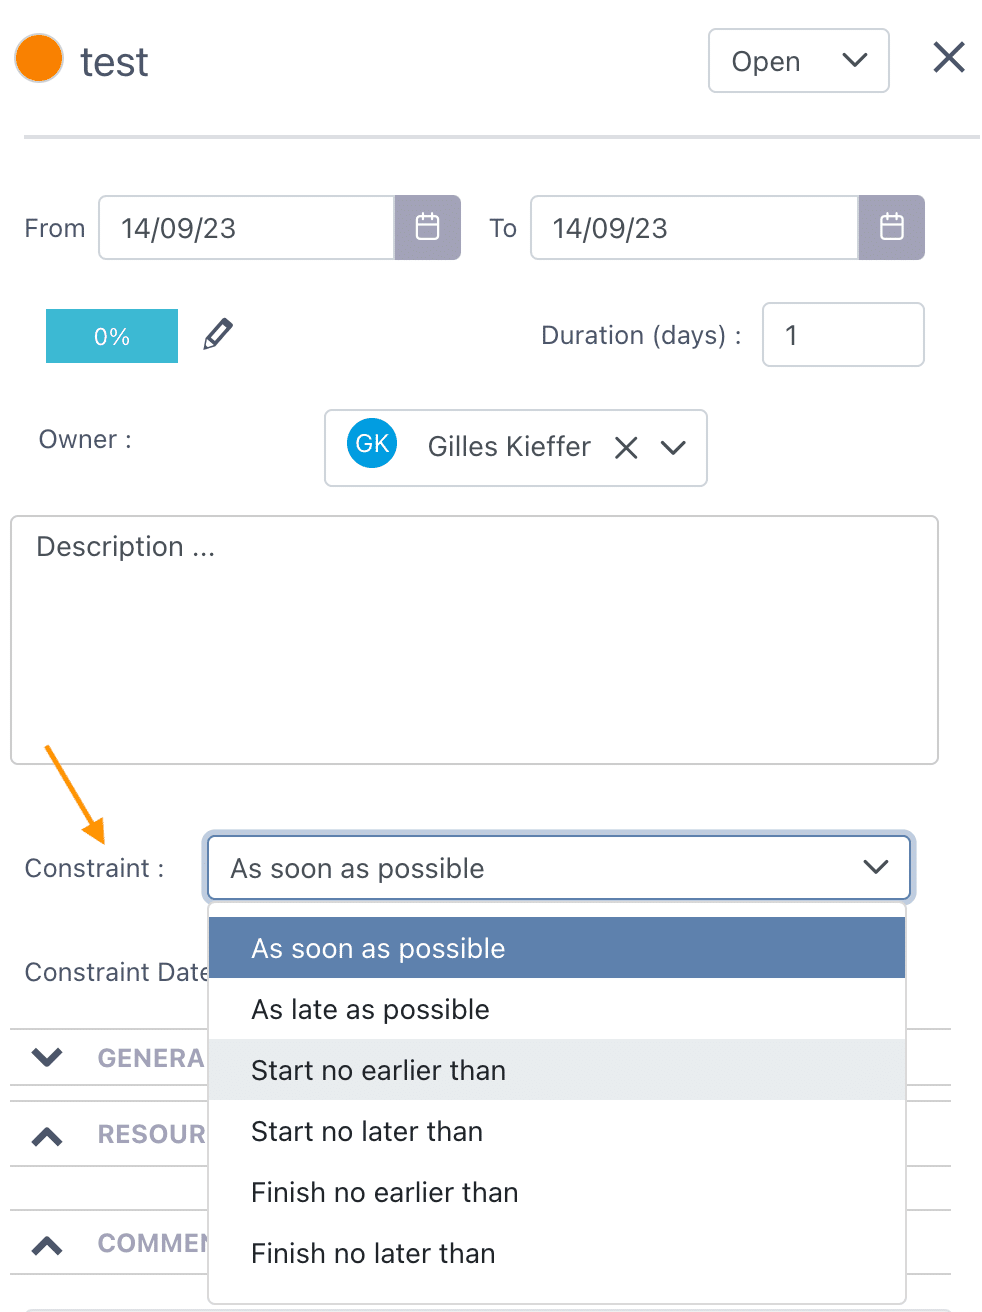
- Scheduling constraint (see Project management)
- Deadline, priority, status, description
Dependencies
Dependencies are created visually in the Gantt (drag between two bars) or via the edit panel. FoxPlan supports the four classic links:
| Link | Meaning |
|---|---|
| Finish → Start (FS) | The next task starts when the previous one is finished (default) |
| Start → Start (SS) | Both tasks start at the same time |
| Finish → Finish (FF) | Both tasks end at the same time |
| Start → Finish (SF) | The end of the next is tied to the start of the previous |
A lag (positive or negative, in days) can be applied to each link.
Assign resources
Three ways to assign a resource to a task:
- From the task edit panel, add an allocation and enter a percentage or a number of man-days
- Drag and drop from the Resources panel (🪪 icon in the toolbar) onto a Gantt bar — a small form then asks for
% / man-daysand the budget to charge against if several are available - Bulk assign on several selected tasks via the context menu
The resources panel shows for each member their workload percentage over the visible period, with a color code (under-load / load / over-load).
Auto schedule
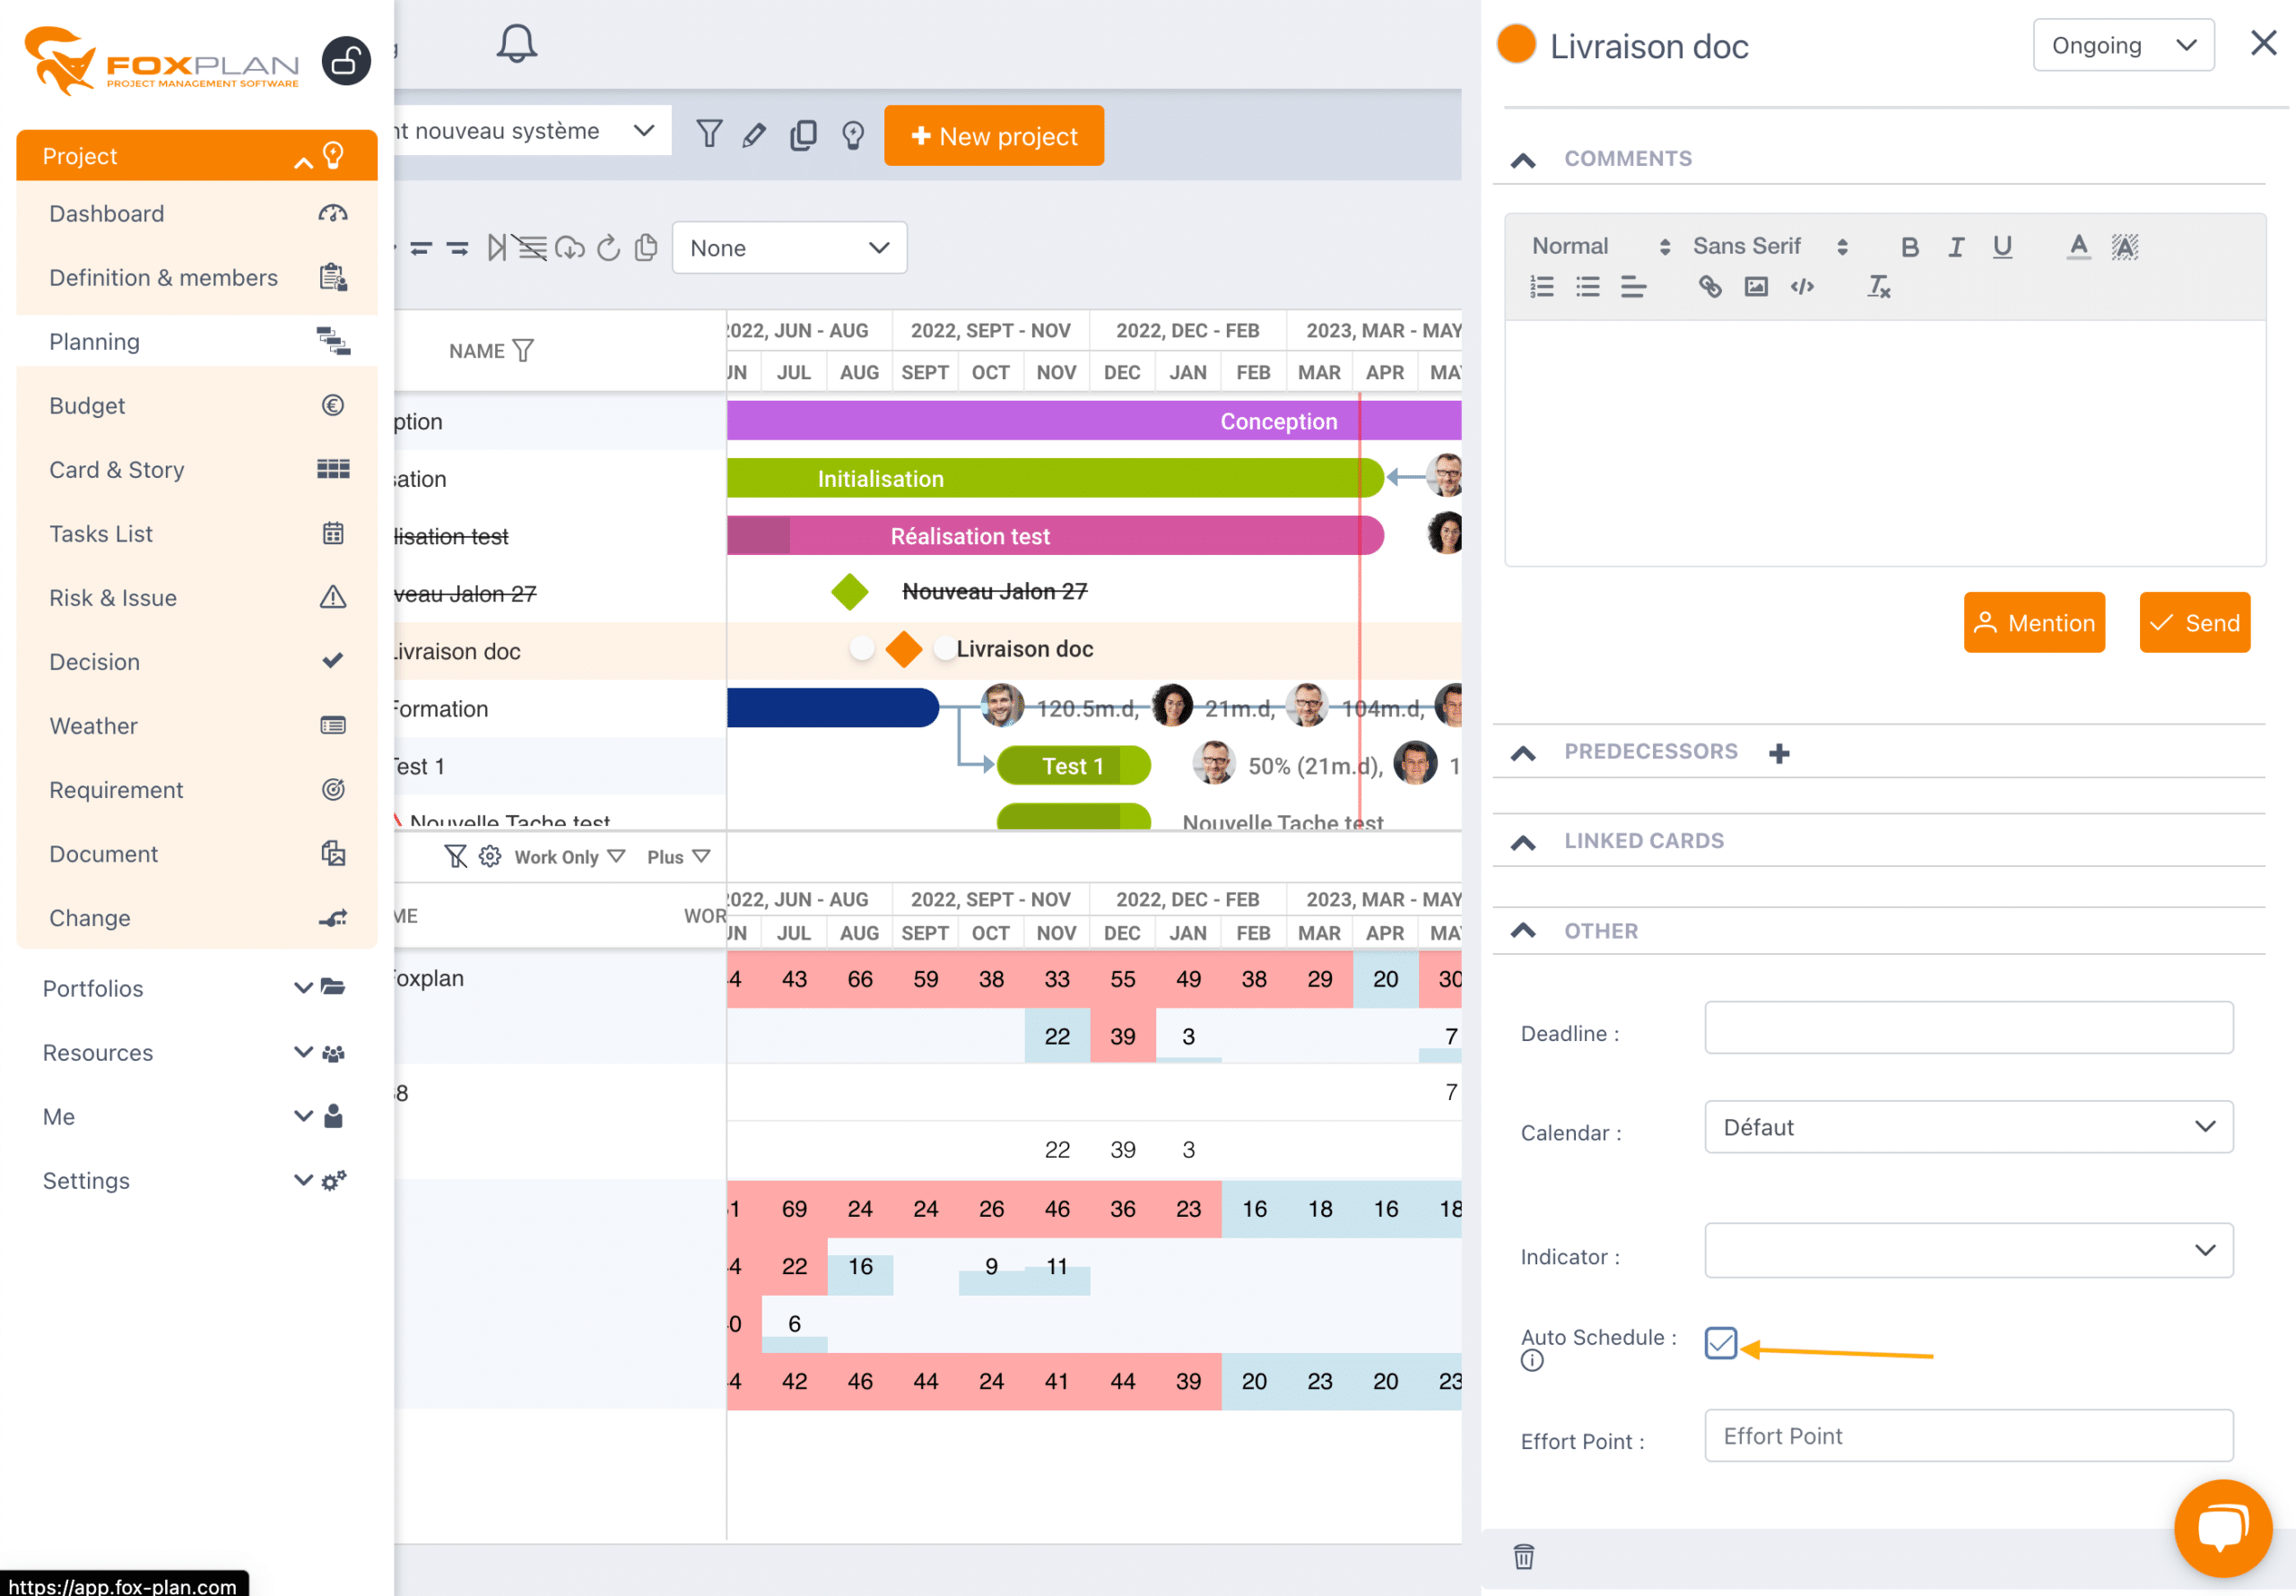
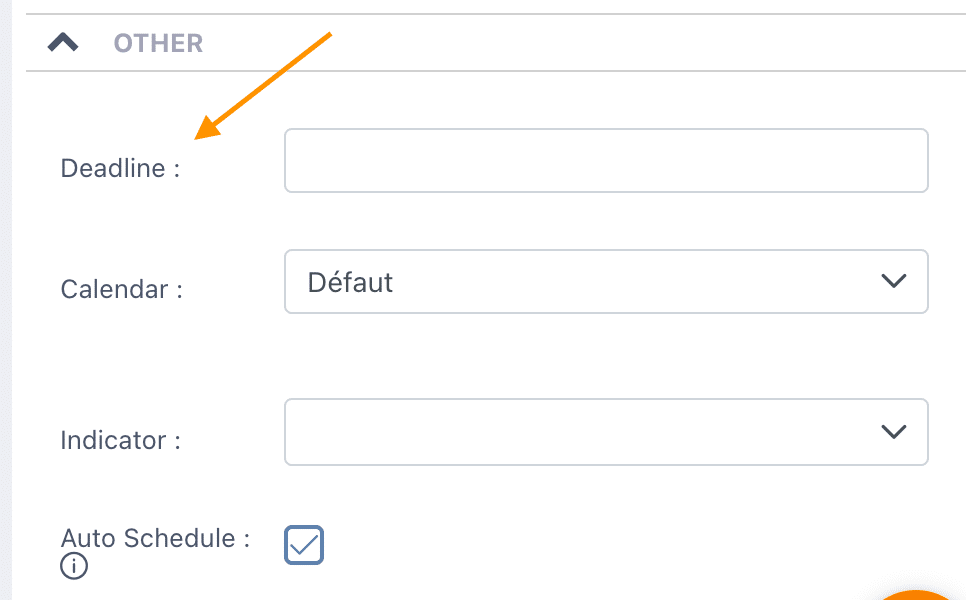
Auto schedule automatically recomputes the task dates while respecting their dependencies and constraints. It is enabled task by task, in the Other section of the edit panel.
When a change triggers a pending recompute, a ✅ Validate and ❌ Cancel button appear on the right side of the toolbar: you preview the effect before saving.
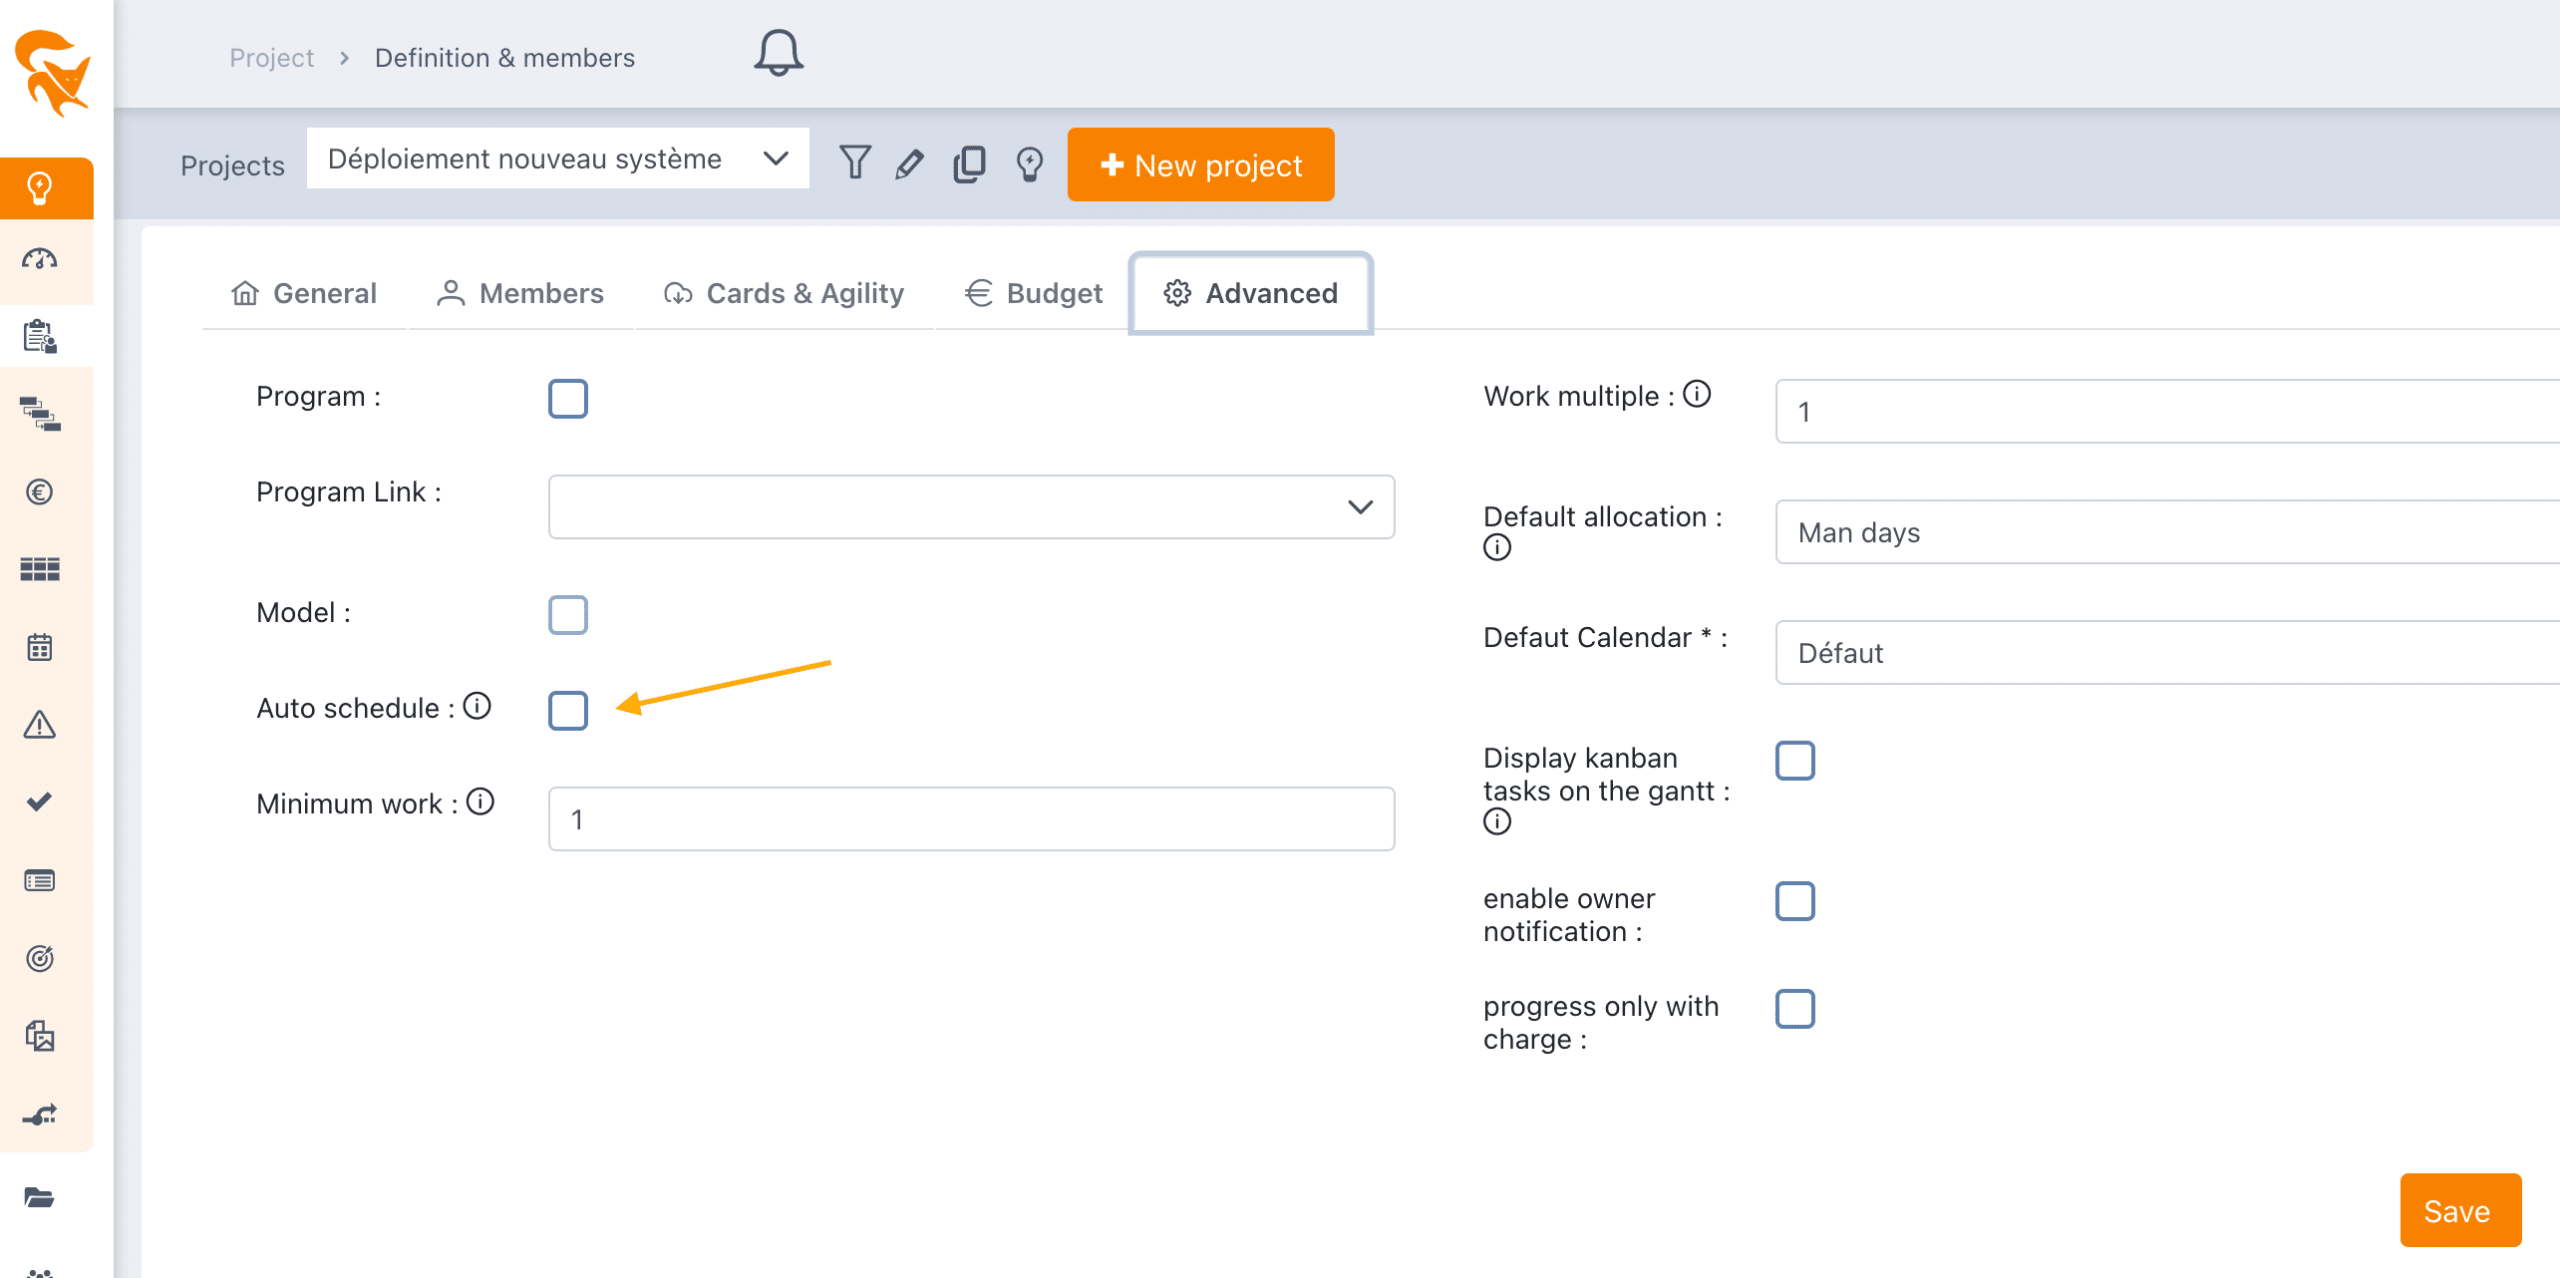
The default settings (auto-schedule on or off for new tasks) are configured under Definition & Members at the project level.
View settings
The ⚙️ icon opens a dialog with three tabs:
Columns
Selects the visible columns in the left grid (Name, Start, End, Duration, Progress, Resources, Budget, custom fields, etc.). Order and width are memorized and can be saved in a favorite.
Baselines
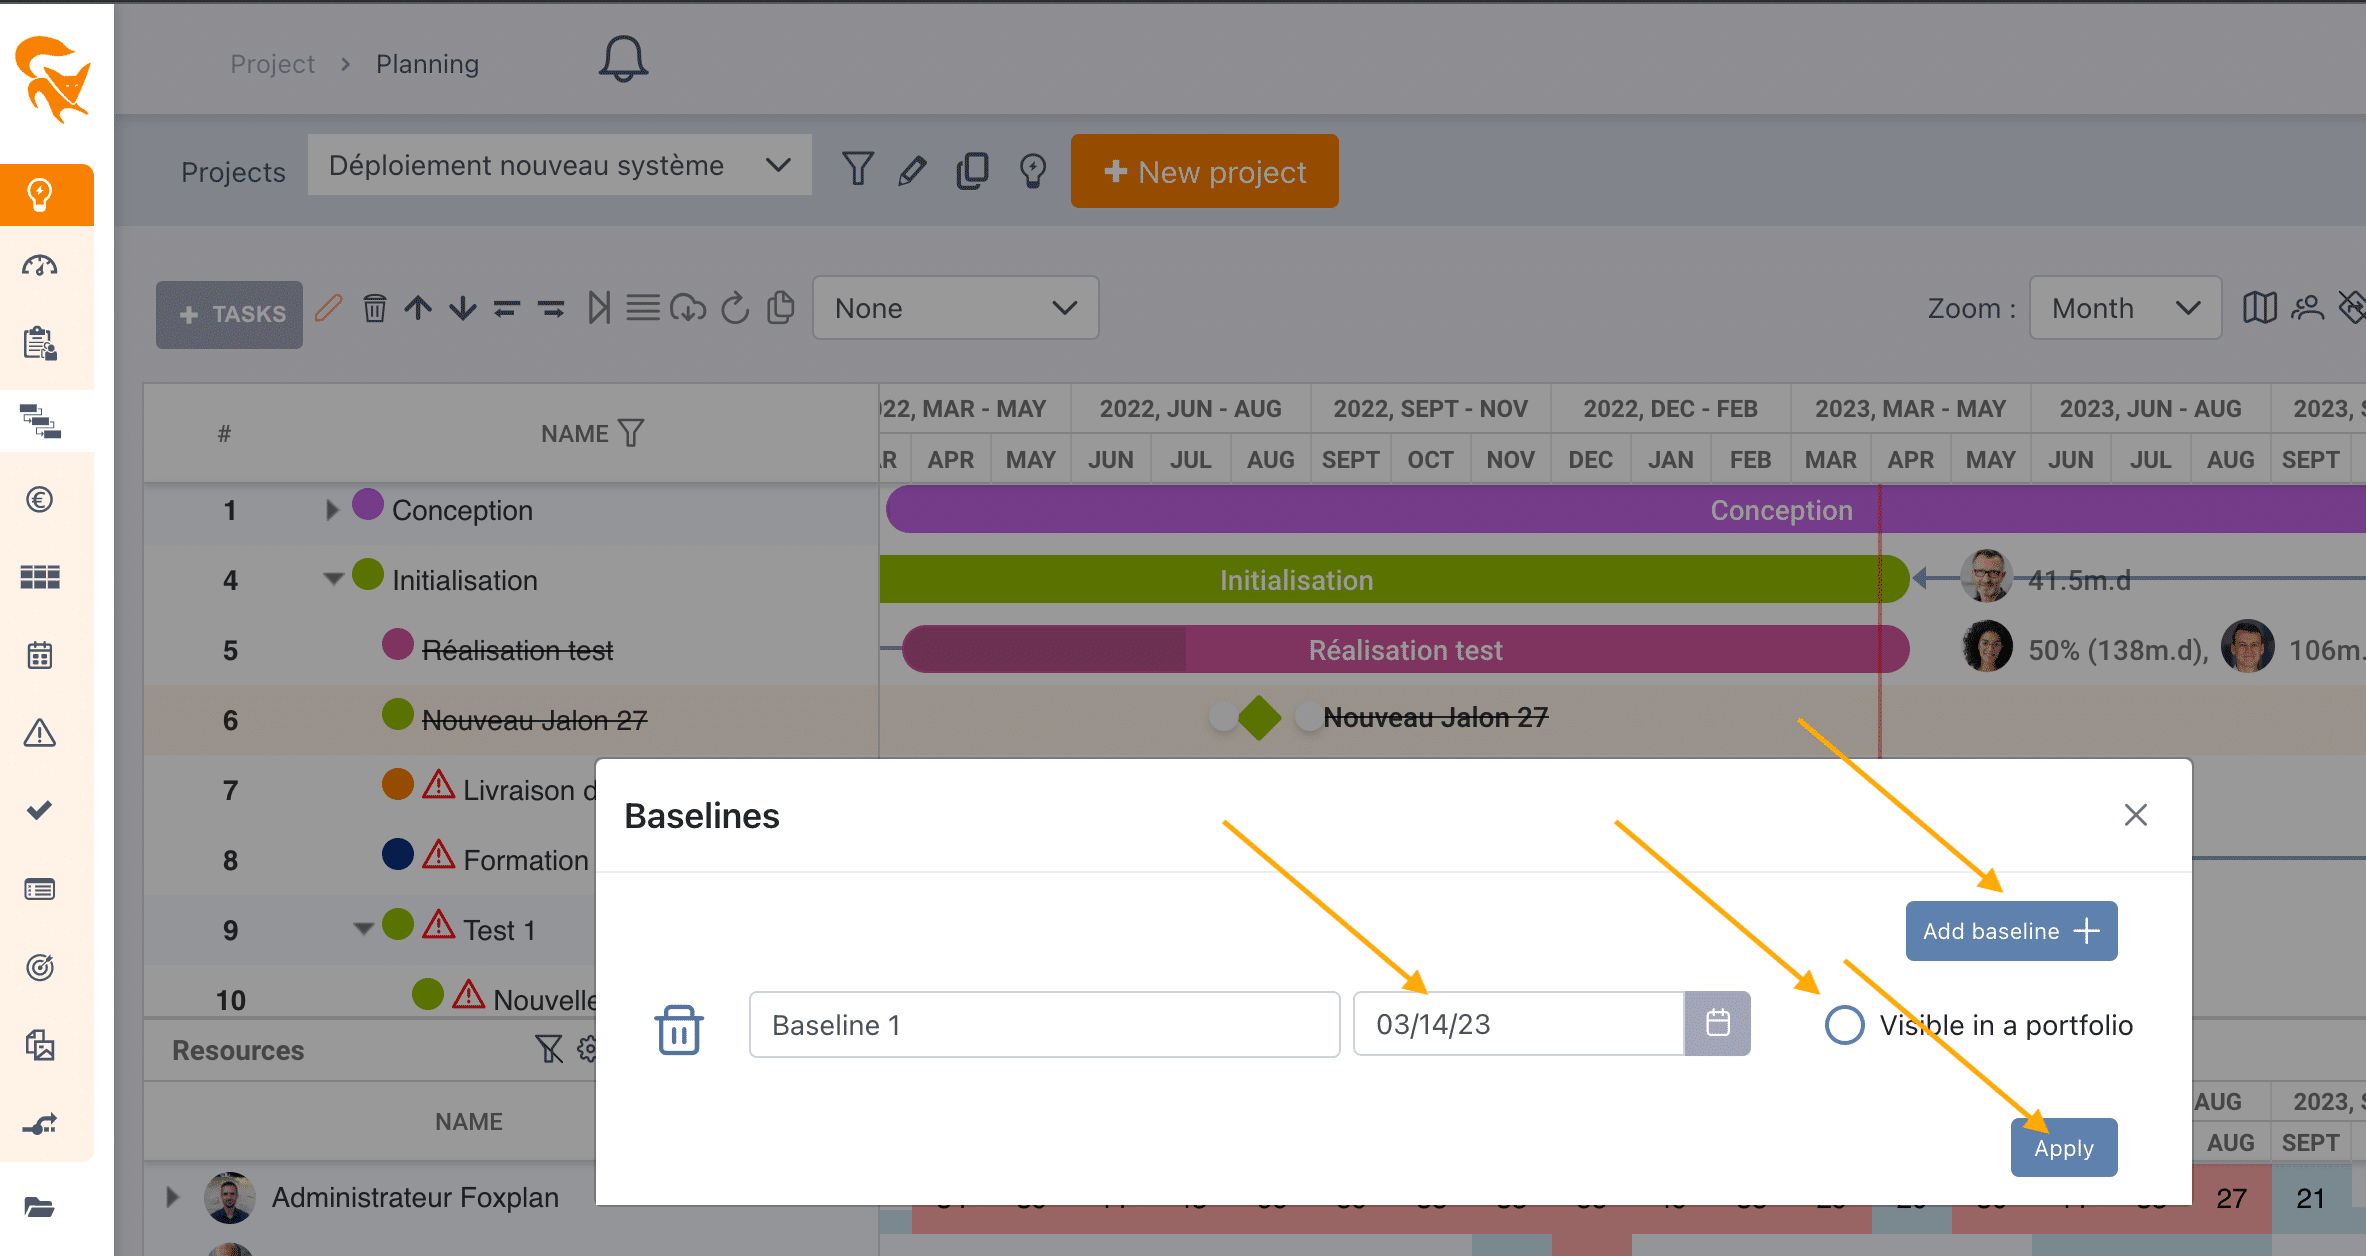
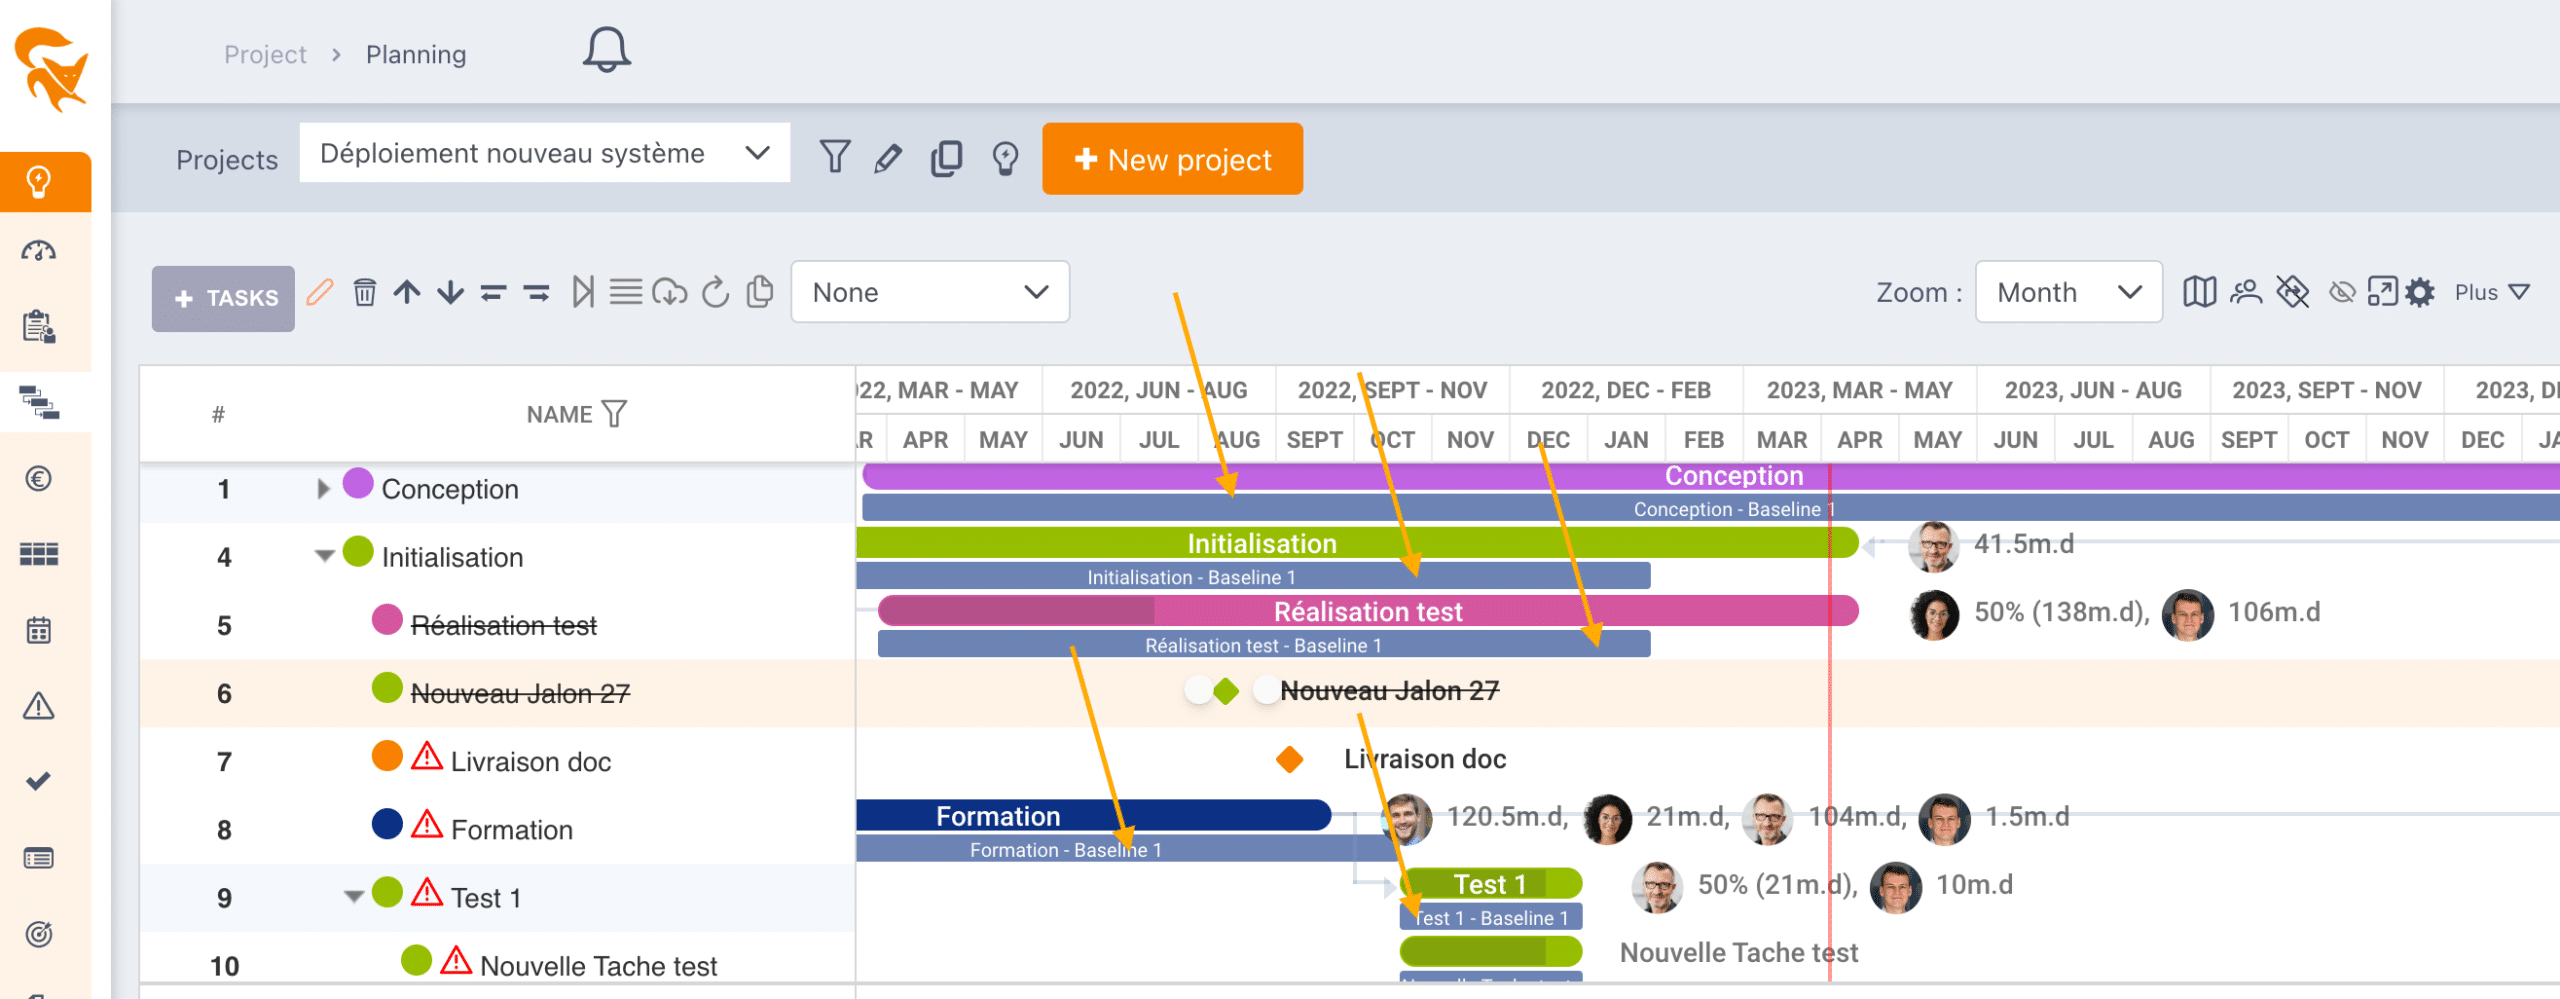
A baseline is a snapshot of the planning at a given point in time, useful to compare the initial planning with the actual.
- Show / hide the active baseline in the Gantt
- + Add a baseline — label + date
- Choose the baseline visible at portfolio level (radio)
- 🗑️ Delete a baseline
Visualize
Toggle the display of:
- Actual — overlay of real progress on the bars
- Critical path — highlights the sequence driving the project end date
- Week number in the time scale
- Avatar of resources on the bars
- Alerts (delays, missed deadlines)
Filter and search
- Search by task name in the toolbar drop-down
- Advanced filters via favorite: by owner, by status, by period, by custom field
- Display period (📅 icon) — restricts the visible time window
- Indicators ⚠️ — a click isolates tasks in alert
Jira synchronization
For a project linked to Jira, a Start sync button shows in the toolbar. It triggers a two-way import / export of tickets and their status.
Permissions
Editing the planning follows the member's role in the project:
| Role | Planning edition |
|---|---|
| Project Admin | ✅ Full edit |
| Project Leader | ✅ Full edit |
| Reader | 👁️ Read-only |
| Resource | 👁️ Read-only (can update progress on their own tasks if the workspace allows it) |
Full details in Project members.
See also
- Project management — project creation, scheduling constraints, deadlines
- Undo and redo — recover from a mistake on the planning
- Card & Story — the complementary agile view
- Budget management — how allocations feed budgets
Before a major milestone, take a baseline: you will then be able to objectively measure the slippage and explain it at the steering committee.